New Update: Rising Oil Costs are Affecting Retirement Plans. Will you be impacted?
Averaging Your Dollar Vs. One-time Investment for Allstate Employees

Energy market instability persists, with crude prices fluctuating between $50 and $120 per barrel and annualized volatility running around 80%. The effects reach well beyond the energy sector. Energy price swings affect insurer investment portfolios and the broader economic conditions that drive policy demand and claims patterns. Comprehensive financial planning at Allstate benefits from understanding how energy price volatility creates indirect effects on inflation, interest rates, and portfolio valuations that affect long-term wealth building. Professional guidance can help you navigate the indirect effects of oil volatility on your retirement planning and ensure your strategy accounts for these dynamics.


Many Allstate employees and retirees have told us how difficult it feels to evaluate certain investment strategies. To evaluate DCA as an investment strategy we will compare it to lump sum investing for rolling 10-year investment periods with monthly steps. This means that starting with the first available month we will examine DCA and lump sum investing through the following decade of returns, and then move the start point one month ahead. For most data series in our sample, this results in 485 10-year periods. For Canada, we have 652 periods, and 1013 for the US. We will evaluate a 12-month DCA implementation, which means splitting up a lump sum into 12 equal monthly investments, against a single lump sum investment. The following chart shows an approximate allocation between cash and stocks over the course of a 12-month DCA period for $1,000,000 of starting cash.
Â
Figure 1 – Dollar-Cost Averaging Illustration
Â

Â
Before finalizing any estate plan, it is worth examining how Allstate's employer-sponsored benefits fit into the broader picture. According to publicly available information, Allstate maintains an active defined benefit pension plan, which provides retirement income based on factors such as years of service and compensation history. Allstate also offers retiree healthcare benefits to eligible employees, which can provide meaningful coverage for those who retire before reaching Medicare eligibility at age 65. Because the specifics of your pension formula, vesting schedule, and benefit eligibility depend on your individual employment history and plan documents, We encourage you to review your Summary Plan Description (SPD) or speak with Allstate's HR or benefits team for the most current details.
Source:Â Benjamin Felix, Portfolio Manager, PWL Capital Inc.
Â
In our model, the cash will earn interest at the rate of One-Month US Treasury Bills while it is waiting to be invested. The portfolios are 100% invested in stocks when fully implemented. All analysis has been conducted in US dollars using monthly returns for One-Month US Treasury Bills and the six global stock markets listed in Table 1.
Â
Table 1 – Stock Market Indexes
Â

Â
Source: Benjamin Felix, Portfolio Manager, PWL Capital Inc.
Â
In order to evaluate LSI relative to DCA, we have chosen to look at the ending performance of an investment after 10 years. First, we evaluated the full data series for each market to understand the average outcomes. We isolated the most extreme bad outcomes for LSI to examine how DCA performed in those periods. Knowing that we cannot predict when LSI will have its worst outcomes, we then compared LSI to DCA during bear markets and when stock prices are high.

Â
Â
Data source:Â Dimensional Returns Web, CRSP, PWL Capital Inc.
Â
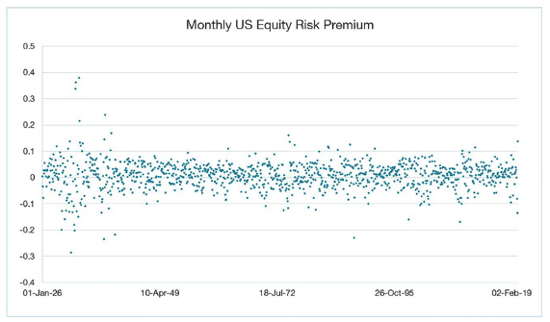
The monthly US equity premium has been remarkably consistent, within a range, throughout history. It has an arithmetic average of 0.65%, and it has been positive 60% of the time. There tend to be periods, visible in Figure 2, where the monthly premium becomes more volatile; volatility clustering is a well-known phenomenon. Over periods longer than one month we also observe characteristic negative skewness - frequent small gains and a few extreme losses.
Â
Given the nature of stock returns, we would expect a stock investor to achieve positive returns with roughly the same frequency as the equity risk premium being positive. For the remainder of this paper, we will be comparing lump sum investing to dollar-cost averaging in terms of absolute returns, as opposed to observing their risk premiums. US stock returns have been positive in absolute terms 63% of the time in the historical data.

For most markets, and on average across markets, we find that roughly two-thirds of the time LSI beats DCA over 10-year periods in terms of ending assets. The exception is Japan which is unsurprising given its unique long-term stock market outcome; Japan’s equity market has trailed One-Month US Treasury Bills since 1990.
Â
Table 2 – LSI vs. DCA for 10-Year Historical Periods
Â

Â
Data source: Dimensional Returns Web, CRSP, MSCI, S&P Dow Jones Indices, PWL Capital Inc.
Â
The basic insight that we draw from this result is that, on average, LSI leads to greater ending wealth than DCA. To quantify the extent to which LSI tends to beat DCA we examined the 10-year annualized performance difference for the full sample. An annualized figure stated as a percentage makes for an easy comparison to familiar items like fees and withholding taxes. On average, DCA is leaving a meaningful amount of expected returns on the table at 0.38% annualized over ten years in the historical data; this should not be a surprise considering that DCA delays exposure to higher expected returning stocks.
Â
Table 3 – LSI vs. DCA Annualized 10-Year Performance Difference
Â

Â
Â
Comparing average outcomes is interesting but it does not speak to the dispersion of outcomes. Even if DCA is worse on average in terms of expected average outcomes, maybe it offers some protection on the downside. To assess this, we calculate the difference in annualized returns for LSI and DCA over 10-year periods and sort the data into percentiles. The 10th percentile is the bottom 10% of outcomes, the 50th percentile is the median, and the 90th percentile is the top 10%.
Â
Table 4 – Difference in Annualized Returns (LSI – DCA)
Â

Â
Data source:Â Dimensional Returns Web, CRSP, MSCI, S&P Dow Jones Indices, PWL Capital Inc.
Â
It should be clear from Table 4 that LSI is beating DCA by a healthy margin on average. In the best 10% of outcomes (90th percentile), more has been gained by LSI over DCA than what has been lost in the worst 10% of outcomes. The median outcome is positive, and the distribution is negatively skewed. None of this should be a surprise considering the positive expected risk premium of stocks over treasury bills, and the left-skewed distribution of stock returns. Figure 3 shows the shape of the distribution of the differences in outcomes for LSI less DCA in terms of 10-year annualized returns.
Â
Figure 3 – Distribution of Differences in 10-Year Annualized Outcomes (LSI - DCA)
Â

Â
Data source:Â Dimensional Returns Web, CRSP, MSCI, S&P Dow Jones Indices, PWL Capital Inc.
Â
At the most extreme, the far left and right tails of the distribution, LSI does look worse than DCA. This observation is consistent with a negatively skewed distribution; we see that most of the outcomes are good, but the worst outcomes are more extreme than the best outcomes. This validates the idea that DCA might be able to offer protection from the worst outcomes, but it comes at a significant cost in terms of expected returns.

Â
Table 5 – LSI vs. DCA in the 10th Percentile LSI Historical Periods
Â

Â
Data source:Â Dimensional Returns Web, CRSP, MSCI, S&P Dow Jones Indices, PWL Capital Inc.
Â
In half of our markets, LSI still beats DCA most of the time even when LSI has delivered its worst historical outcomes; this is also true with an equal-weighted average of all markets in the sample. The results are not as strongly in favor of LSI as the full data series but remember that we have intentionally selected the worst LSI outcomes for this sample. While the number of outcomes is evenly matched, the bad outcomes in this case are worse in magnitude than the good ones. The result is a negative difference in annualized 10-year performance. This should not be surprising considering our intentional selection of the worst LSI outcomes in the sample.
Â
Table 6 – Difference in Annualized Returns for 10th Percentile LSI Outcomes (LSI – DCA)
Â

Â
Data source:Â Dimensional Returns Web, CRSP, MSCI, S&P Dow Jones Indices, PWL Capital Inc.
Â
Even under artificial conditions of a known bad future outcome for LSI, DCA offers less than a 50% shot at an improvement. DCA does however offer an edge when the magnitude of positive and negative outcomes is considered – despite the roughly even split between good and bad outcomes, the bad outcomes are worse than the good outcomes are good. This seems to give credence to the mythical ability of DCA to improve an extremely bad LSI outcome. An important nuance in the data is that the worst LSI outcomes relative to other LSI outcomes do not correspond with the worst LSI outcomes relative to DCA outcomes. The most extreme instances of underperformance for LSI relative to DCA have less to do with the LSI outcome being extremely bad and more to do with the DCA outcome being extremely good. In other words, lucky timing for DCA, as opposed to avoiding unlucky timing for LSI, drives the difference in the most extreme cases.
Â
Given that it is impossible to predict which time periods will result in the worst outcomes for a lump sum investment, we next turn to two signals commonly believed to offer forward-looking insight into future investment returns.

Â

Â
Data source:Â Dimensional Returns Web, CRSP, MSCI, S&P Dow Jones Indices, PWL Capital Inc.
Â
We again find that LSI produces a better outcome than DCA most of the time in most countries in the sample. Allstate employees and retirees should note that the US experience is significantly impacted by the enormous volatility and seemingly perpetual market drops in the 1930s. We find that, on average, LSI beats DCA by a 10-year annualized 0.25% when the investment period begins with the month after a drop of 20% or more has occurred. Echoing the experience of the full data series we also see that there has historically been more to gain from LSI in the 90th percentile of outcomes than there has been to lose in the 10th percentile. DCA is not offering protection from bad outcomes without also exposing us to a greater risk of missing good outcomes.
Â
Table 8 – Difference in Annualized Returns Starting at Bear Markets (LSI – DCA)
Â

Â
Data source:Â Dimensional Returns Web, CRSP, MSCI, S&P Dow Jones Indices, PWL Capital Inc.
Â
It's important for Allstate employees to keep in mind that our trigger to begin the investment period is a 20% drop. In some cases, a 20% drop is followed by more drops, while in other cases it is followed by a rebound. Based on the data in Tables 7 and 8 we can see that rebounds are more impactful, on average than further drops. This results in LSI delivering a better result than DCA most of the time, even during periods of market volatility.

Â

Â
Data source:Â Dimensional Returns Web, CRSP, Barclays Research, PWL Capital Inc.
Â
While it may seem concerning, this observation suffers from a massive bias: at any point in time we do not have the full set of past and future Shiller CAPE data to base a decision - we only have past data in our possession. We adjust for this by measuring the market’s expensiveness only relative to historical data for each data point. For example, for January 1926 we are comparing the Shiller CAPE to the set of data from February 1872 to January 1926, not from February 1872 to May 2026 to test for expansiveness. In this case, LSI beats DCA 63.70% of the time.
Â
Table 10 – LSI vs. DCA when Stock Prices are High Relative to Backward-looking History
Â

This exercise is to remind Allstate employees and retirees that while valuations may look high at a point in time, they can always get higher. Japan might be a particularly interesting case study on the usefulness of market valuations in making the LSI vs. DCA decision. We have less data for Japan, so instead of comparing historical Japanese data, we will compare Japanese valuations to US data to determine expensiveness. The highest level of the monthly Shiller CAPE for the full US historical data series is 44.19 which occurred in December 1999. Japan exceeded this level in May 1986 with a Shiller CAPE of 44.31. While the Japanese market did eventually crash in 1990, there are 29 monthly observations following May 1986 where LSI beats DCA by a wide margin. Even starting in November 1988, with a Shiller CAPE of 72.07, LSI beats DCA in Japan in terms of 10-year annualized returns.
Â
It is well-known that future returns tend to be relatively low when valuations are relatively high. Despite this, using valuation as a signal to time the LSI vs. DCA decision has historically resulted in unfavorable outcomes most of the time.

Â
If DCA seems like a solution to avoiding pain when investing new money, we think that it is a reasonable strategy. However, we also think that if the fear of loss is so great that DCA needs to be employed to make an asset allocation decision palatable, that asset allocation may be too aggressive. It should feel comfortable to invest a lump sum in a risk-appropriate portfolio. We do not want to imply that DCA should never be employed, but we do believe that if it feels necessary to use DCA in order to implement an asset allocation decision, it may be wise to revisit the portfolio altogether.


Therefore, we encourage you to have your plan updated a few months before your potential retirement date as well as an annual review. It should be emphasized that neither The Retirement Group, LLC nor any of its employees can engage in the practice of law or accounting and that nothing in this document should be taken as an effort to do so. We look forward to working with tax and/or legal professionals you may select to discuss the relevant ramifications of our recommendations.
Throughout your retirement years we will continue to update you on issues affecting your retirement through our complimentary and proprietary newsletters, workshops and regular updates. You may always reach us at (800) 900-5867.

How does the Allstate Retirement Plan ensure that employees are adequately informed of their retirement benefits and options? Specifically, what resources does Allstate offer to help participants understand the complexities of their benefits, and how can employees stay updated on changes to the Allstate Retirement Plan?
Allstate Retirement Plan resources: Allstate provides resources through its website AllstateGoodLife.com, where employees can model different pension scenarios, compare benefit estimates, and request pension statements. Employees are also encouraged to contact the Allstate Benefits Center for personalized support. Regular updates about the plan, including changes in compensation and interest credits, ensure participants stay informed(Allstate_Retirement_Pla…).
In what ways does the Allstate Retirement Plan accommodate employees who might need to take a leave of absence due to military duty? Discuss how the plan's provisions align with federal regulations and the protections offered to ensure that employees do not lose accrued benefits during such leaves.
Military leave accommodations: The Allstate Retirement Plan adheres to the Uniformed Services Employment and Reemployment Rights Act (USERRA), ensuring that employees on military leave continue to accrue benefits and vesting service under the plan. Interest credits will continue to be added to their accounts during the leave(Allstate_Retirement_Pla…).
What factors determine the calculation of the Cash Balance Benefit under the Allstate Retirement Plan? Detail how annual compensation is integrated into benefit calculations, and what limitations exist concerning eligible compensation for retirement benefits.
Cash Balance Benefit calculation: The Cash Balance Benefit is based on pay credits and interest credits. Pay credits depend on the employee’s years of vesting service, and are calculated as a percentage of their annual compensation. Annual compensation includes salary, bonuses, and certain paid leave, but excludes severance payments and certain awards. The benefit is subject to IRS limits(Allstate_Retirement_Pla…).
Can you explain the differences between the Final Average Pay Benefit and the Cash Balance Benefit as part of the Allstate Retirement Plan? Discuss how benefits are accrued under each formula and the implications for employees transitioning between plans.
Final Average Pay vs. Cash Balance Benefit: The Final Average Pay Benefit was frozen as of December 31, 2013, for participants, while the Cash Balance Benefit is an ongoing accrual based on eligible annual compensation and interest credits. Employees with preserved Final Average Pay Benefits can receive both this benefit and a Cash Balance Benefit, creating a dual structure for those transitioning between plans(Allstate_Retirement_Pla…).
What options do Allstate employees have for designating beneficiaries under the Retirement Plan, and how do these choices impact the benefits received by the designated individuals? Discuss the procedures for updating beneficiary designations and the importance of keeping this information current.
Beneficiary designations: Employees can designate beneficiaries for their Cash Balance and Final Average Pay Benefits through AllstateGoodLife.com. It is crucial to update beneficiary designations after significant life events such as marriage, as spousal consent is required for naming someone other than the spouse. Keeping this information current ensures smooth benefit distribution(Allstate_Retirement_Pla…).
How does the Allstate Retirement Plan define and measure Vesting Service, and why is it critical for employees to understand this definition? Explain the implications of Vesting Service on eligibility for benefits and the calculations involved in determining retirement pay.
Vesting Service definition: Vesting Service is used to determine eligibility for benefits and is based on the total years of service with Allstate, including military leave and breaks in service under certain conditions. Employees must understand this concept, as vesting impacts their eligibility to receive retirement benefits, generally after three years of service(Allstate_Retirement_Pla…).
What steps must Allstate employees follow to commence payment of their retirement benefits when they reach eligibility? Outline the necessary paperwork and timelines involved, as well as how timely submissions can affect payout dates.
Commencing retirement benefits: To commence payment of retirement benefits, employees must notify the Allstate Benefits Center 30 to 60 days prior to their selected Payment Start Date. This process involves submitting paperwork via the website or phone, with the payment date starting on the first day of the month(Allstate_Retirement_Pla…)(Allstate_Retirement_Pla…).
How do the provisions of the Allstate Retirement Plan address scenarios where an employee transitions to independent contractor status? Discuss the impact of this transition on their previously accrued benefits and any applicable rules that pertain to their retirement planning.
Transition to independent contractor status: Independent contractors are generally not eligible for the Allstate Retirement Plan. However, employees who previously accrued benefits under the plan before transitioning to contractor status will retain those benefits, but no further credits will accrue during their time as a contractor(Allstate_Retirement_Pla…).
How are employees of Allstate notified of their rights under ERISA, and what resources are available for participants who believe their rights have been violated? Discuss the role of the Administrative Committee in safeguarding participant rights and ensuring compliance with federal regulations.
ERISA rights and resources: Employees are informed of their rights under ERISA through plan documents and can contact the Allstate Benefits Center for assistance. The Administrative Committee ensures compliance with ERISA and oversees participant rights, including providing resources for claims and disputes(Allstate_Retirement_Pla…).
How can employees contact Allstate to learn more about their retirement benefits detailed in the Allstate Retirement Plan? Include specifics on the best methods for reaching out, including contact numbers and online resources available to employees for additional assistance.
Contacting Allstate for retirement plan information: Employees can contact Allstate through the Allstate Benefits Center at (888) 255-7772 or online at AllstateGoodLife.com. The website provides access to pension estimates, beneficiary management, and retirement planning tools(Allstate_Retirement_Pla…).
Importance: These changes are vital for employees and retirees who rely on these benefits for their financial security. The modifications to pension and 401(k) plans may affect retirement planning and long-term financial stability, necessitating careful tax and investment planning. Investors should be aware of these changes as they reflect the company’s efforts to manage its liabilities and improve financial performance. Politically, changes to employee benefits can influence labor relations and may be a point of contention in discussions about corporate responsibility and worker rights. | | Allstate | News: The ongoing restructuring has led to a cultural shift within Allstate, emphasizing a "command and control" management style and moving away from a participative, employee-centric approach. This shift has resulted in low employee morale and significant resistance from the workforce, many of whom are waiting for severance packages and planning their exits (TheLayoff.com) (TheLayoff.com).
Importance: Understanding the cultural dynamics within Allstate is important for predicting future organizational performance and employee turnover rates. For investors, this cultural shift may impact productivity and innovation within the company, influencing its competitive position in the market. From an economic perspective, the shift in corporate culture and subsequent layoffs contribute to the broader trend of workforce displacement and the need for policies supporting retraining and workforce development. Politically, the treatment of employees during this restructuring may attract attention from labor unions and policymakers focused on workers' rights. |

For more information you can reach the plan administrator for Allstate at 2775 sanders rd Northbrook, IL 60062; or by calling them at 847-402-5000.
https://www.allstate.com/docs/benefits/pension_plan2023.pdf - Page 14 https://www.allstate.com/docs/benefits/401k_plan2024.pdf - Page 21 https://www.allstate.com/docs/benefits/rsu_plan2022.pdf - Page 13 https://www.allstate.com/docs/benefits/stock_options2023.pdf - Page 18 https://www.allstate.com/docs/benefits/healthcare2024.pdf - Page 27 https://www.allstate.com/docs/benefits/annual_report2023.pdf - Page 9 https://www.allstate.com/docs/benefits/employee_handbook2022.pdf - Page 10 https://www.allstate.com/docs/benefits/retirement_guide2023.pdf - Page 23 https://www.allstate.com/docs/benefits/benefit_highlights2024.pdf - Page 16 https://www.allstate.com/docs/benefits/benefit_summary2023.pdf - Page 28
Help shape our next stories
Choose the topics you’d love to read more about. Your input helps us focus on content that matters to you.