New Update: Rising Oil Costs are Affecting Retirement Plans. Will you be impacted?
Averaging Your Dollar Vs. One-time Investment for American Electric Power Employees



Barron’s: Awarded on 9/12/2025 (Mega RIA) for 6/30/24-6/30/25. Paid for logo use. Forbes: Awarded 10/1/25 for 3/31/24-3/31/25. Paid for logo use. USA Today: Awarded 4/15/26 for the five-year period ending January 2026. Paid for logo use.

Energy market instability persists, with crude prices fluctuating between $50 and $120 per barrel and annualized volatility running around 80%. The effects reach well beyond the energy sector. Fleet diesel costs and inflation-driven rate case pressures create indirect but meaningful exposure to sustained crude price swings. For American Electric Power employees focused on long-term financial health, periods of oil-driven economic volatility reinforce the value of diversified strategies that account for how energy markets influence the broader investment landscape. Working with a financial advisor can help you position your planning strategy for sustained energy price uncertainty.


Many American Electric Power employees and retirees have told us how difficult it feels to evaluate certain investment strategies. To evaluate DCA as an investment strategy we will compare it to lump sum investing for rolling 10-year investment periods with monthly steps. This means that starting with the first available month we will examine DCA and lump sum investing through the following decade of returns, and then move the start point one month ahead. For most data series in our sample, this results in 485 10-year periods. For Canada, we have 652 periods, and 1013 for the US. We will evaluate a 12-month DCA implementation, which means splitting up a lump sum into 12 equal monthly investments, against a single lump sum investment. The following chart shows an approximate allocation between cash and stocks over the course of a 12-month DCA period for $1,000,000 of starting cash.
Â
Figure 1 – Dollar-Cost Averaging Illustration
Â

Â
Before finalizing any estate plan, it is worth examining how American Electric Power's employer-sponsored benefits fit into the broader picture. According to publicly available information, American Electric Power maintains an active defined benefit pension plan, which provides retirement income based on factors such as years of service and compensation history. American Electric Power also offers retiree healthcare benefits to eligible employees, which can provide meaningful coverage for those who retire before reaching Medicare eligibility at age 65. Because the specifics of your pension formula, vesting schedule, and benefit eligibility depend on your individual employment history and plan documents, We encourage you to review your Summary Plan Description (SPD) or speak with American Electric Power's HR or benefits team for the most current details.
Source:Â Benjamin Felix, Portfolio Manager, PWL Capital Inc.
Â
In our model, the cash will earn interest at the rate of One-Month US Treasury Bills while it is waiting to be invested. The portfolios are 100% invested in stocks when fully implemented. All analysis has been conducted in US dollars using monthly returns for One-Month US Treasury Bills and the six global stock markets listed in Table 1.
Â
Table 1 – Stock Market Indexes
Â

Â
Source: Benjamin Felix, Portfolio Manager, PWL Capital Inc.
Â
In order to evaluate LSI relative to DCA, we have chosen to look at the ending performance of an investment after 10 years. First, we evaluated the full data series for each market to understand the average outcomes. We isolated the most extreme bad outcomes for LSI to examine how DCA performed in those periods. Knowing that we cannot predict when LSI will have its worst outcomes, we then compared LSI to DCA during bear markets and when stock prices are high.

Â
Â
Data source:Â Dimensional Returns Web, CRSP, PWL Capital Inc.
Â
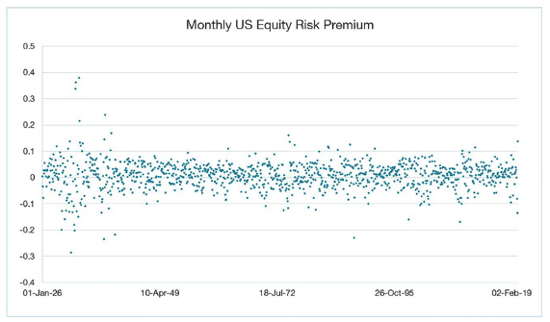
The monthly US equity premium has been remarkably consistent, within a range, throughout history. It has an arithmetic average of 0.65%, and it has been positive 60% of the time. There tend to be periods, visible in Figure 2, where the monthly premium becomes more volatile; volatility clustering is a well-known phenomenon. Over periods longer than one month we also observe characteristic negative skewness - frequent small gains and a few extreme losses.
Â
Given the nature of stock returns, we would expect a stock investor to achieve positive returns with roughly the same frequency as the equity risk premium being positive. For the remainder of this paper, we will be comparing lump sum investing to dollar-cost averaging in terms of absolute returns, as opposed to observing their risk premiums. US stock returns have been positive in absolute terms 63% of the time in the historical data.

For most markets, and on average across markets, we find that roughly two-thirds of the time LSI beats DCA over 10-year periods in terms of ending assets. The exception is Japan which is unsurprising given its unique long-term stock market outcome; Japan’s equity market has trailed One-Month US Treasury Bills since 1990.
Â
Table 2 – LSI vs. DCA for 10-Year Historical Periods
Â

Â
Data source: Dimensional Returns Web, CRSP, MSCI, S&P Dow Jones Indices, PWL Capital Inc.
Â
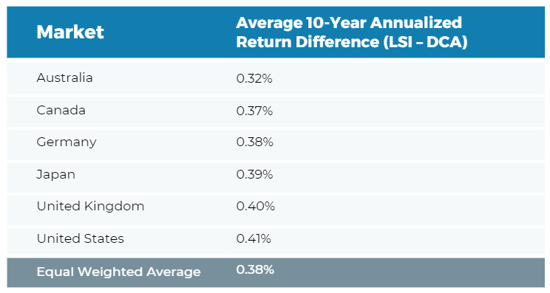
The basic insight that we draw from this result is that, on average, LSI leads to greater ending wealth than DCA. To quantify the extent to which LSI tends to beat DCA we examined the 10-year annualized performance difference for the full sample. An annualized figure stated as a percentage makes for an easy comparison to familiar items like fees and withholding taxes. On average, DCA is leaving a meaningful amount of expected returns on the table at 0.38% annualized over ten years in the historical data; this should not be a surprise considering that DCA delays exposure to higher expected returning stocks.
Â
Table 3 – LSI vs. DCA Annualized 10-Year Performance Difference
Â
Â
Â
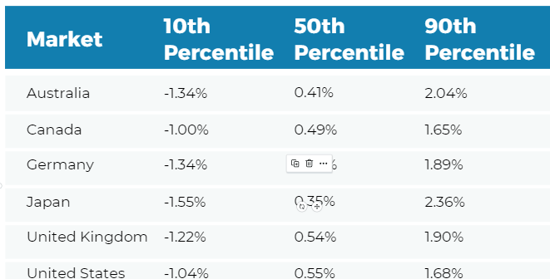
Comparing average outcomes is interesting but it does not speak to the dispersion of outcomes. Even if DCA is worse on average in terms of expected average outcomes, maybe it offers some protection on the downside. To assess this, we calculate the difference in annualized returns for LSI and DCA over 10-year periods and sort the data into percentiles. The 10th percentile is the bottom 10% of outcomes, the 50th percentile is the median, and the 90th percentile is the top 10%.
Â
Table 4 – Difference in Annualized Returns (LSI – DCA)
Â
Â
Data source:Â Dimensional Returns Web, CRSP, MSCI, S&P Dow Jones Indices, PWL Capital Inc.
Â
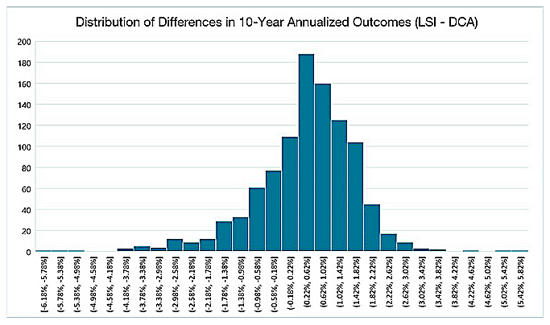
It should be clear from Table 4 that LSI is beating DCA by a healthy margin on average. In the best 10% of outcomes (90th percentile), more has been gained by LSI over DCA than what has been lost in the worst 10% of outcomes. The median outcome is positive, and the distribution is negatively skewed. None of this should be a surprise considering the positive expected risk premium of stocks over treasury bills, and the left-skewed distribution of stock returns. Figure 3 shows the shape of the distribution of the differences in outcomes for LSI less DCA in terms of 10-year annualized returns.
Â
Figure 3 – Distribution of Differences in 10-Year Annualized Outcomes (LSI - DCA)
Â
Â
Data source:Â Dimensional Returns Web, CRSP, MSCI, S&P Dow Jones Indices, PWL Capital Inc.
Â
At the most extreme, the far left and right tails of the distribution, LSI does look worse than DCA. This observation is consistent with a negatively skewed distribution; we see that most of the outcomes are good, but the worst outcomes are more extreme than the best outcomes. This validates the idea that DCA might be able to offer protection from the worst outcomes, but it comes at a significant cost in terms of expected returns.

Â
Table 5 – LSI vs. DCA in the 10th Percentile LSI Historical Periods
Â

Â
Data source:Â Dimensional Returns Web, CRSP, MSCI, S&P Dow Jones Indices, PWL Capital Inc.
Â
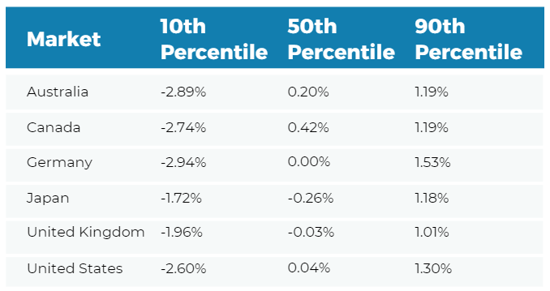
In half of our markets, LSI still beats DCA most of the time even when LSI has delivered its worst historical outcomes; this is also true with an equal-weighted average of all markets in the sample. The results are not as strongly in favor of LSI as the full data series but remember that we have intentionally selected the worst LSI outcomes for this sample. While the number of outcomes is evenly matched, the bad outcomes in this case are worse in magnitude than the good ones. The result is a negative difference in annualized 10-year performance. This should not be surprising considering our intentional selection of the worst LSI outcomes in the sample.
Â
Table 6 – Difference in Annualized Returns for 10th Percentile LSI Outcomes (LSI – DCA)
Â
Â
Data source:Â Dimensional Returns Web, CRSP, MSCI, S&P Dow Jones Indices, PWL Capital Inc.
Â
Even under artificial conditions of a known bad future outcome for LSI, DCA offers less than a 50% shot at an improvement. DCA does however offer an edge when the magnitude of positive and negative outcomes is considered – despite the roughly even split between good and bad outcomes, the bad outcomes are worse than the good outcomes are good. This seems to give credence to the mythical ability of DCA to improve an extremely bad LSI outcome. An important nuance in the data is that the worst LSI outcomes relative to other LSI outcomes do not correspond with the worst LSI outcomes relative to DCA outcomes. The most extreme instances of underperformance for LSI relative to DCA have less to do with the LSI outcome being extremely bad and more to do with the DCA outcome being extremely good. In other words, lucky timing for DCA, as opposed to avoiding unlucky timing for LSI, drives the difference in the most extreme cases.
Â
Given that it is impossible to predict which time periods will result in the worst outcomes for a lump sum investment, we next turn to two signals commonly believed to offer forward-looking insight into future investment returns.

Â

Â
Data source:Â Dimensional Returns Web, CRSP, MSCI, S&P Dow Jones Indices, PWL Capital Inc.
Â
We again find that LSI produces a better outcome than DCA most of the time in most countries in the sample. American Electric Power employees and retirees should note that the US experience is significantly impacted by the enormous volatility and seemingly perpetual market drops in the 1930s. We find that, on average, LSI beats DCA by a 10-year annualized 0.25% when the investment period begins with the month after a drop of 20% or more has occurred. Echoing the experience of the full data series we also see that there has historically been more to gain from LSI in the 90th percentile of outcomes than there has been to lose in the 10th percentile. DCA is not offering protection from bad outcomes without also exposing us to a greater risk of missing good outcomes.
Â
Table 8 – Difference in Annualized Returns Starting at Bear Markets (LSI – DCA)
Â

Â
Data source:Â Dimensional Returns Web, CRSP, MSCI, S&P Dow Jones Indices, PWL Capital Inc.
Â
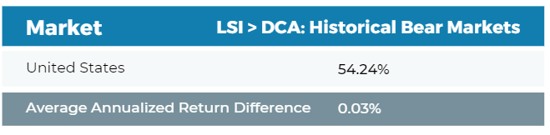
It's important for American Electric Power employees to keep in mind that our trigger to begin the investment period is a 20% drop. In some cases, a 20% drop is followed by more drops, while in other cases it is followed by a rebound. Based on the data in Tables 7 and 8 we can see that rebounds are more impactful, on average than further drops. This results in LSI delivering a better result than DCA most of the time, even during periods of market volatility.

Â
Â
Data source:Â Dimensional Returns Web, CRSP, Barclays Research, PWL Capital Inc.
Â
While it may seem concerning, this observation suffers from a massive bias: at any point in time we do not have the full set of past and future Shiller CAPE data to base a decision - we only have past data in our possession. We adjust for this by measuring the market’s expensiveness only relative to historical data for each data point. For example, for January 1926 we are comparing the Shiller CAPE to the set of data from February 1872 to January 1926, not from February 1872 to May 2026 to test for expansiveness. In this case, LSI beats DCA 63.70% of the time.
Â
Table 10 – LSI vs. DCA when Stock Prices are High Relative to Backward-looking History
Â

This exercise is to remind American Electric Power employees and retirees that while valuations may look high at a point in time, they can always get higher. Japan might be a particularly interesting case study on the usefulness of market valuations in making the LSI vs. DCA decision. We have less data for Japan, so instead of comparing historical Japanese data, we will compare Japanese valuations to US data to determine expensiveness. The highest level of the monthly Shiller CAPE for the full US historical data series is 44.19 which occurred in December 1999. Japan exceeded this level in May 1986 with a Shiller CAPE of 44.31. While the Japanese market did eventually crash in 1990, there are 29 monthly observations following May 1986 where LSI beats DCA by a wide margin. Even starting in November 1988, with a Shiller CAPE of 72.07, LSI beats DCA in Japan in terms of 10-year annualized returns.
Â
It is well-known that future returns tend to be relatively low when valuations are relatively high. Despite this, using valuation as a signal to time the LSI vs. DCA decision has historically resulted in unfavorable outcomes most of the time.

Â
If DCA seems like a solution to avoiding pain when investing new money, we think that it is a reasonable strategy. However, we also think that if the fear of loss is so great that DCA needs to be employed to make an asset allocation decision palatable, that asset allocation may be too aggressive. It should feel comfortable to invest a lump sum in a risk-appropriate portfolio. We do not want to imply that DCA should never be employed, but we do believe that if it feels necessary to use DCA in order to implement an asset allocation decision, it may be wise to revisit the portfolio altogether.


Therefore, we encourage you to have your plan updated a few months before your potential retirement date as well as an annual review. It should be emphasized that neither The Retirement Group, LLC nor any of its employees can engage in the practice of law or accounting and that nothing in this document should be taken as an effort to do so. We look forward to working with tax and/or legal professionals you may select to discuss the relevant ramifications of our recommendations.
Throughout your retirement years we will continue to update you on issues affecting your retirement through our complimentary and proprietary newsletters, workshops and regular updates. You may always reach us at (800) 900-5867.

How does the AEP System Retirement Savings Plan compare to other retirement plans offered by AEP, and what are the key features that employees should consider when deciding how to allocate their contributions? In particular, how might AEP employees maximize their benefits through the different contribution types available under the AEP System Retirement Savings Plan?
The AEP System Retirement Savings Plan (RSP) is a qualified 401(k) plan that allows employees to contribute up to 50% of their eligible compensation on a pre-tax, after-tax, or Roth 401(k) basis. AEP matches 100% of the first 1% and 70% of the next 5% of employee contributions, making it a valuable tool for maximizing retirement savings. Employees can select from 19 investment options and a self-directed brokerage account to tailor their portfolios. This plan compares favorably to other AEP retirement plans by offering flexibility in contributions and matching opportunities(KPCO_R_KPSC_1_72_Attach…).
What are the eligibility requirements for the AEP Supplemental Benefit Plan for AEP employees, and how does this plan provide benefits that exceed the limitations imposed by the IRS? AEP employees who are considering this plan need to understand how the plan's unique features may impact their retirement planning strategies.
The AEP Supplemental Benefit Plan is a nonqualified defined benefit plan designed for employees whose compensation exceeds IRS limits. It provides benefits beyond those offered under the AEP Retirement Plan by including additional years of service and incentive pay. This plan disregards IRS limits on annual compensation and benefits, allowing participants to receive higher benefits. Employees should consider how these enhanced features can significantly boost their retirement income when planning their strategies(KPCO_R_KPSC_1_72_Attach…).
Can you explain how the Incentive Compensation Deferral Plan functions for eligible AEP employees and what specific conditions need to be met for participating in this plan? Furthermore, AEP employees should be aware of the implications of deferring a portion of their compensation and how it affects their financial planning during retirement.
The AEP Incentive Compensation Deferral Plan allows eligible employees to defer up to 80% of their vested performance units. This plan does not offer matching contributions but provides investment options similar to those in the qualified RSP. Employees may not withdraw funds until termination of employment, though a single pre-2005 contribution withdrawal is permitted, subject to a 10% penalty. Employees need to consider how deferring compensation affects their cash flow and long-term retirement plans(KPCO_R_KPSC_1_72_Attach…).
How can AEP employees achieve their retirement savings goals through the other Voluntary Deferred Compensation Plans offered by AEP? In addressing this question, it would be essential to consider the specific benefits and potential drawbacks of these plans for AEP employees in terms of financial security during retirement.
AEP's other Voluntary Deferred Compensation Plans allow eligible participants to defer a portion of their salary and incentive compensation. These plans are unfunded and do not offer employer contributions, making them ideal for employees seeking additional tax-advantaged retirement savings. However, since they are not funded by the company, participants assume some risk, and the plans may not provide immediate financial security(KPCO_R_KPSC_1_72_Attach…).
What options are available for AEP employees to withdraw funds from their accounts under the AEP System Retirement Plan, and how do these options compare to those offered by the AEP System Retirement Savings Plan? AEP employees need to be informed about these withdrawal options to make effective plans for their post-retirement needs.
Under the AEP System Retirement Plan, employees can access their funds upon retirement or termination, with options including lump-sum payments or annuities. The AEP System Retirement Savings Plan offers more flexibility with in-service withdrawals and various distribution options. Employees should carefully compare these withdrawal choices to align with their retirement needs and tax considerations(KPCO_R_KPSC_1_72_Attach…).
In what scenarios might AEP employees benefit from being grandfathered into their retirement plans, and how does this affect their retirement benefits? A comprehensive understanding of the implications of being grandfathered can provide significant advantages for eligible AEP employees as they prepare for retirement.
AEP employees grandfathered into older retirement plans, such as those employed before 12/31/2000, benefit from higher retirement payouts under previous pension formulas. This offers a significant advantage, as employees can receive more favorable terms compared to newer cash balance formulas. Understanding these grandfathered benefits can help eligible employees plan for a more secure retirement(KPCO_R_KPSC_1_72_Attach…).
How can AEP employees take advantage of the matching contributions offered under the AEP System Retirement Savings Plan and what strategies can be implemented to maximize these benefits? Understanding the contribution limits and matching algorithms of AEP is crucial for employees aiming to enhance their retirement savings.
AEP employees can maximize matching contributions under the AEP System Retirement Savings Plan by contributing at least 6% of their compensation, receiving a 100% match on the first 1% and 70% on the next 5%. To enhance savings, employees should ensure they are contributing enough to take full advantage of the company's match, effectively doubling a portion of their contributions(KPCO_R_KPSC_1_72_Attach…).
What are the key considerations for AEP employees regarding the investment options available in the AEP System Retirement Savings Plan, and how can they tailor their portfolios to align with their long-term financial goals? Employees should be equipped with the knowledge to make informed investment decisions that influence their retirement outcomes.
The AEP System Retirement Savings Plan offers 19 investment options and a self-directed brokerage account, providing employees with a variety of choices to build their portfolios. Employees should evaluate these options based on their risk tolerance and long-term financial goals, aligning their investments with their retirement timeline and desired outcomes(KPCO_R_KPSC_1_72_Attach…).
As AEP transitions into more complex retirement options, what resources are available for employees seeking additional assistance with their benefits, particularly regarding the complexities of the AEP Supplemental Retirement Savings Plan? It’s essential for AEP employees to know where and how to obtain accurate support for navigating their retirement plans.
As AEP introduces more complex retirement options, employees can access resources such as financial advisors, internal retirement planning tools, and educational webinars to navigate their benefits. Understanding these resources can help employees make informed decisions, particularly when dealing with the intricacies of the AEP Supplemental Retirement Savings Plan(KPCO_R_KPSC_1_72_Attach…).
How can AEP employees contact the company for more information regarding their retirement benefits and plans? Knowing the right channels for communication is important for AEP employees to gain clarity and guidance on their retirement options and to address any specific inquiries or uncertainties they may have about their benefits.
AEP employees can contact the company’s HR department or use online portals to access information about their retirement benefits and plans. Timely communication through these channels ensures employees receive support and clarity regarding any concerns or inquiries related to their retirement options(KPCO_R_KPSC_1_72_Attach…).

For more information you can reach the plan administrator for American Electric Power at 7 longs peak dr Broomfield, CO 80021; or by calling them at 1-303-939-6100.
https://aep.com/investors/financialreportsandreleases/AnnualReportsProxies/AEP_AnnualReport_2022.pdf - Page 42 https://aep.com/investors/financialreportsandreleases/AnnualReportsProxies/AEP_AnnualReport_2023.pdf - Page 39 https://aep.com/about/businesses/AEP_PensionPlan2024.pdf - Page 23 https://aep.com/about/businesses/AEP_401kPlan2023.pdf - Page 17 https://aep.com/about/businesses/AEP_RSUs2022.pdf - Page 14 https://aep.com/about/businesses/AEP_HealthcareOptions2024.pdf - Page 11 https://aep.com/about/businesses/AEP_StockOptions2023.pdf - Page 19 https://aep.com/about/businesses/AEP_AnnualReport2022.pdf - Page 28 https://aep.com/about/businesses/AEP_EmployeeHandbook2023.pdf - Page 32 https://aep.com/about/businesses/AEP_AnnualReport2024.pdf - Page 21
Help shape our next stories
Choose the topics you’d love to read more about. Your input helps us focus on content that matters to you.