/General/General%209.png?width=1280&height=853&name=General%209.png)
DON’T PANIC
Both stocks and bonds are off to one of their worst starts to the year in history. The S&P 500 Index declined -12.92% through the end of April 2022, and other broad market indices were similarly down double digits.
1
What’s worse, investors, like those living in Texas or New York, are losing nearly as much on the fixed income side of their portfolios as they are on the equity side. The Bloomberg U.S. Aggregate bond index, a broad measure of domestic fixed income, suffered its largest quarterly loss (-5.93%) since 1980 to start the year
2
and is down -9.50% through the end of April. The current environment has left investors feeling like there is nowhere to hide, and even prompted some to exit markets or go to cash, which is why we find it important to discuss this with our clients from PC Connection.
Such a rash response could lead investors to miss out on an eventual rebound since historical equity performance post-corrections, as well as strong underlying economic fundamentals, suggest a bounce back in stocks will occur sooner rather than later. If you are unsure about your specific situation, feel free to speak to one of our retirement-focused advisors today !
THE BULL CASE FOR EQUITIES: USING HISTORY AS OUR GUIDE
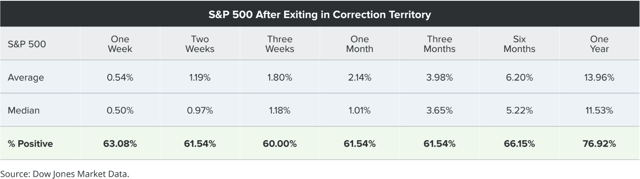
The S&P 500 fell back into correction territory just 22 trading days after leaving; its fastest re-entry into negative 10% performance since November 2008, during the turmoil of the Great Financial Crisis.
3
The table provided below for our clients from PC Connection excludes periods when a correction turned into a bear market, and maps out how the S&P 500 has performed after exiting a correction. Based on data going back to 1928, the S&P 500 saw a median gain of +11.5% after exiting a correction, and an average gain of nearly +14%—rising nearly 77% of the time.
4
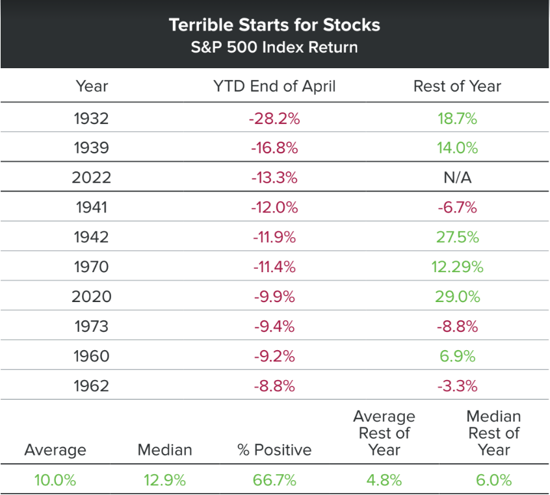
We'd like to remind our clients from PC Connection that a bad start to the year is not always a sign of things to come. 2022 ranks as the third-worst start to a year ever for the S&P 500 Index.
Still, looking at the 10 worst starts shows that stocks tend to bounce back nicely thereafter, up 10% on average. As you can see in the charts provided for our PC Connection clients, continued losses in the final eight months are rare, and double-digit gains are more than possible. 5
Featured Video
Articles you may find interesting:
- 8 Tenets of Choosing a Mutual Fund
- Use of Escrow Accounts: Divorce
- Section 303 Stock Redemption Buy-Sell Agreement
- Medicare Open Enrollment Is Here: How Are Costs Changing for 2023?
- 2022 High Net Worth Tax Planning
- Policy Roadmap
- Section 179 Deductions
- Learn About the Path to Retirement
- Contemplating Change: 7 Key Factors When Considering a Transition from Your Company
- How Are Workers Impacted by Inflation & Rising Interest Rates?
- Lump-Sum vs Annuity and Rising Interest Rates
- Advice for Retirees Trying to Survive a Bear Market
- 5 Most Important Things to do Before Leaving Your Company
- Internal Revenue Code Section 409A (Governing Nonqualified Deferred Compensation Plans)
THE BULL CASE FOR MARKETS: STRONG ECONOMIC FUNDAMENTALS
Beyond historical performance supporting a second-half rally in stocks, the critical fundamentals underlying the U.S. economy remain quite strong. Resilient demand, healthy corporate and consumer financial positioning, and rising earnings can act as shock absorbers through the volatility market observers expect to persist in the near- to medium-term.
The initial estimate for first-quarter economic growth showed an unexpected contraction. U.S. real GDP (inflation-adjusted) declined 1.4%, versus +6.9% growth in the previous quarter. 1 This sharp deceleration was due to a drag from exports, a decline in inventory spending following a sizable increase the prior quarter, and to a lesser extent a contraction in government spending. More importantly, consumer spending, which accounts for nearly 70% of the U.S. economy, continued to grow at a solid pace. Personal consumption accelerated slightly to 2.7% from 2.5% the previous month, driven by spending on services. For perspective, consumer spending grew at an average pace of 2.3% over the past decade. 1
In another positive sign for the economy, business investment increased 9.2%, the most in a year. Broad momentum in capital spending should persist as companies accelerate their pace of automation and investment amid ongoing labor shortages. Ultimately, consumers are benefiting from an exceptionally tight labor market and rising wages. With pandemic effects fading, we believe consumption will continue to support above-average economic growth this year and would like to remind our clients from PC Connection to keep this in mind. Adding one final caveat, economic growth and stock market growth can diverge significantly, as evidenced by the current state of markets.
Importantly, attempting to time the market by exiting existing positions and re-entering a perceived “safer” environment, generally leaves shareholders much worse off. Investors are best served by sticking to a plan, weathering market downturns with smart, risk-adjusted asset allocations, and holding on through the turnaround as the most significant gains are captured
Economic Definitions
GDP: Gross domestic product (GDP) measures the final market value of all goods and services produced within a country. It is the most frequently used indicator of economic activity. The GDP by expenditure approach measures total final expenditures (at purchasers’ prices), including exports fewer imports. This concept is adjusted for inflation.
Index Definitions
S&P 500: The S&P 500® is widely regarded as the best single gauge of large-cap U.S. equities and serves as the foundation for a wide range of investment products. The index includes 500 leading companies and captures approximately 80% coverage of available market capitalization.
Bloomberg Barclays US Agg Bond: The Bloomberg Barclays US Aggregate Bond Index is a broad-based flagship benchmark that measures the investment grade, US dollar-denominated, fixed-rate taxable bond market. The index includes Treasuries, government-related and corporate securities, MBS (agency fixed-rate pass-throughs), ABS and CMBS (agency
and non-agency).
Sources
1. Bloomberg
2. Sam Goldfarb, “Bond Market Suffers Worst Quarter in Decades,” The Wall Street Journal, last modified March 31, 2022, Bond Market Suffers Worst Quarter in Decades – WSJ.
3. William Watts, “A Brutal April knocked the S&P 500 into its second stock-market correction of 2022,” MarketWatch, last modified May 2, 2022, A brutal April knocked the S&P 500 into its second stock-market correction of 2022 – MarketWatch.
4. William Watts, “S&P 500 exits correction: Here’s what history says happens next to U.S. stock-market benchmark,” MarketWatch, last modified March 30, 2022, S&P 500 exits correction: What history says happens next to stock-market benchmark – MarketWatch.
5. Ryan Detrick, “4 Things You Didn’t Know, But Need To,” LPL Research, last modified May 4, 2022, 4 Things You Didn’t Know, But Need To | LPL Financial Research (lplresearch.com).


-2.png?width=300&height=200&name=office-builing-main-lobby%20(52)-2.png)


-2.png)